Static SPR
Endpoint Screening
Scouting and screening before kinetic SPR — yes/no binding, concentration determination, quick verification.
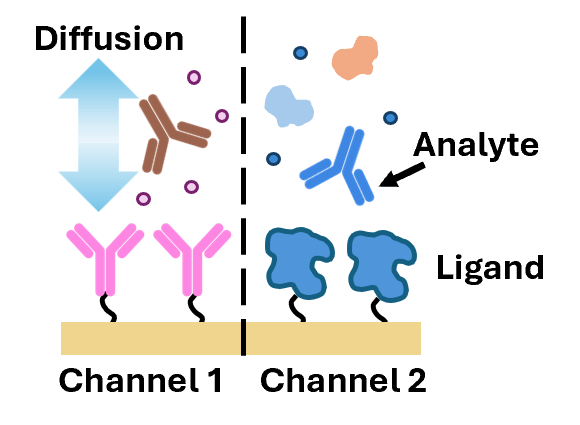
- Like
label-free ELISA : ligand–analyte interaction depends on diffusion, concentration, and binding strength - Binding measured as
Apparent KD from concentration titration at ½ RUmax Concentration determination of active analyte in complex media (e.g. crude lysate)- Quick verification of protein expression
- Contact time seconds to hours —
slow interactions can be measured - Low viscosity buffers and biomolecules
10–500 kDa recommended2 - Up to
4 independent experiments (4 channels) on the P4SPR1
Kinetic SPR
Quantitative Binding
Sensitive, real-time binding characterization — both the strength and rate of binding are measured.
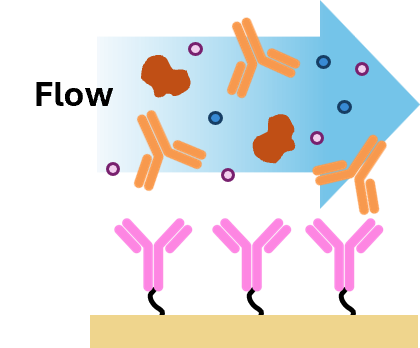
- Constant flow of analyte — both
strength and rate of binding measured - Quantitative
KD = koff / kon from kinetic fitting - Can transfer static SPR conditions directly to kinetic mode
- Controlled flow accommodates a broader range:
100+ Da to 500+ kDa - Suitable for
low analyte concentrations — better real-time sensitivity - Steeper upward curve = faster association; steeper downward = faster dissociation
- Up to
2 independent experiments (4 channels, 2 with reference) on the P4SPR1
Data Output Differences
Static SPR Output
- Association without dissociation
- End-point response units are analyzed
- Apparent KD estimated at ½ RUmax from concentration titration
Kinetic SPR Output
- Both association and dissociation measured in real time
- Quantitative KD calculated from koff / kon
- Steeper upward curve = faster association; steeper downward = faster dissociation
Side-by-Side Comparison
| Static SPR | Kinetic SPR | |
|---|---|---|
| Use case | Screening, end-points | Real-time binding characterization |
| Binding parameters | Apparent KD | kon, koff, KD |
| Concentration determination | Yes | Yes |
| Analyte size range | 10 kDa – 500 kDa2 | 100 Da – 500+ kDa |
| Analyte types | Peptides, antibodies, protein complexes | Small molecules, peptides, antibodies, nanoparticles, vesicles |
| Experiments per run | Up to 4 independent1 | Up to 2 independent (4 channels) |
| Ligand required | > 10 µg | > 10 µg |
| Sample injection | Manual | Semi-automated (pump) |
| Average assay time | 5 – 15 min | 5 – 20 min |
1 Four different conditions (media, surface chemistries, ligands, etc.) in one setup using the P4SPR.
2 In some cases, small molecules and large nanoparticles can also be used — contact us for details.
2 In some cases, small molecules and large nanoparticles can also be used — contact us for details.
Methods commonly used alongside SPR
Western blot · ELISA · Immunoprecipitation · Isothermal calorimetry (ITC) · Biolayer interferometry (BLI) · Fluorimetry · Atomic force microscopy (AFM)