Introduction
Energetic materials such as RDX (1,3,5-trinitroperhydro-1,3,5-triazine) account for a large part of the explosive contamination at active and former military installations worldwide. Because RDX compounds are not significantly retained by soils and biodegrade very slowly, RDX percolates through the ground and contaminates groundwater — a drinking water source for surrounding populations. RDX is classified as potentially carcinogenic and can damage the nervous system if inhaled or ingested.1
Continuous monitoring of RDX levels in groundwater is essential for public safety. The current gold standard is EPA method 8330b — an HPLC-UV procedure performed in centralized laboratories. Although sensitive, the method is time-intensive: sampling, transportation, storage, and sample preparation are required before any result can be generated. The lead time is typically at least 24 hours, and days or weeks between sampling and testing is not unusual.
Field testing using label-free sensing methods can cut the sampling-to-result time from days to hours, significantly reducing the risk of RDX exposure in areas of concern. Surface Plasmon Resonance (SPR) has proven its label-free sensing and real-time monitoring benefits in biosensing; this application note demonstrates its use for on-site environmental monitoring.
Experiment Setup
1Field Deployment of the P4SPR
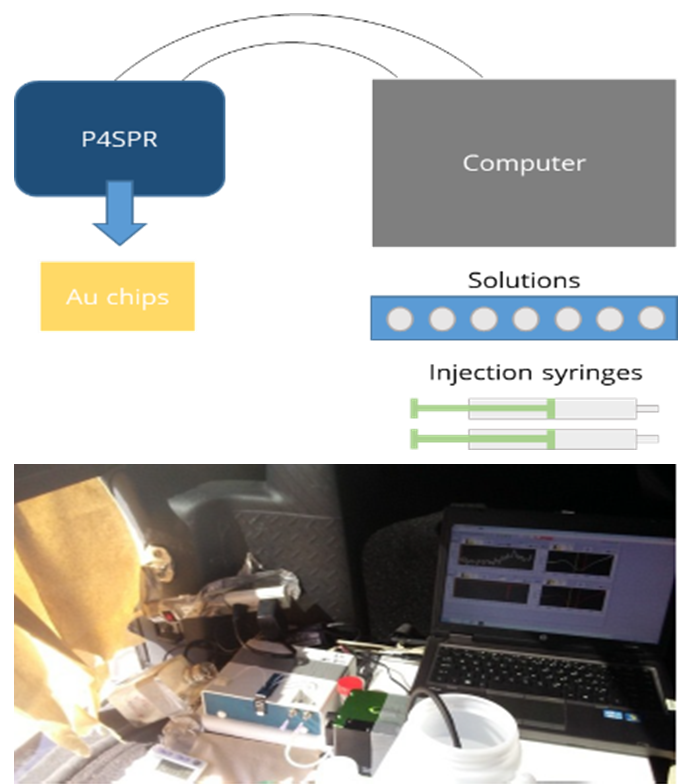
The P4SPR was deployed at groundwater sampling sites during both Canadian winter and summer conditions (-20 °C to +30 °C). A minimal temporary shelter — a tent, a trailer, or the tailgate of an SUV — was sufficient to protect the instrument from the elements. The device was powered by a laptop via USB, with the laptop battery backed by a generator.
Well water samples were drawn in two stages using peristaltic pumps to control flow at the device. First, well water was pumped into a large collection bucket; then, water from the bucket was pumped into the P4SPR at 1 mL/min.
2Microfluidic Channel Configuration
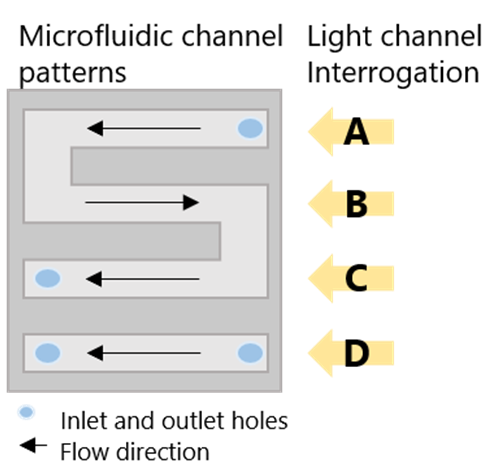
Water samples flowed through the S-shaped portion of the microfluidic cell (channels A–C) in direct contact with the RDX-selective sensor chip. An uncontaminated water sample from an upstream well was used as reference in channel D to correct for temperature variations in real time. Each sample was measured in triplicate and corrected automatically.
3Sensor Functionalization — Molecularly Imprinted Polymer
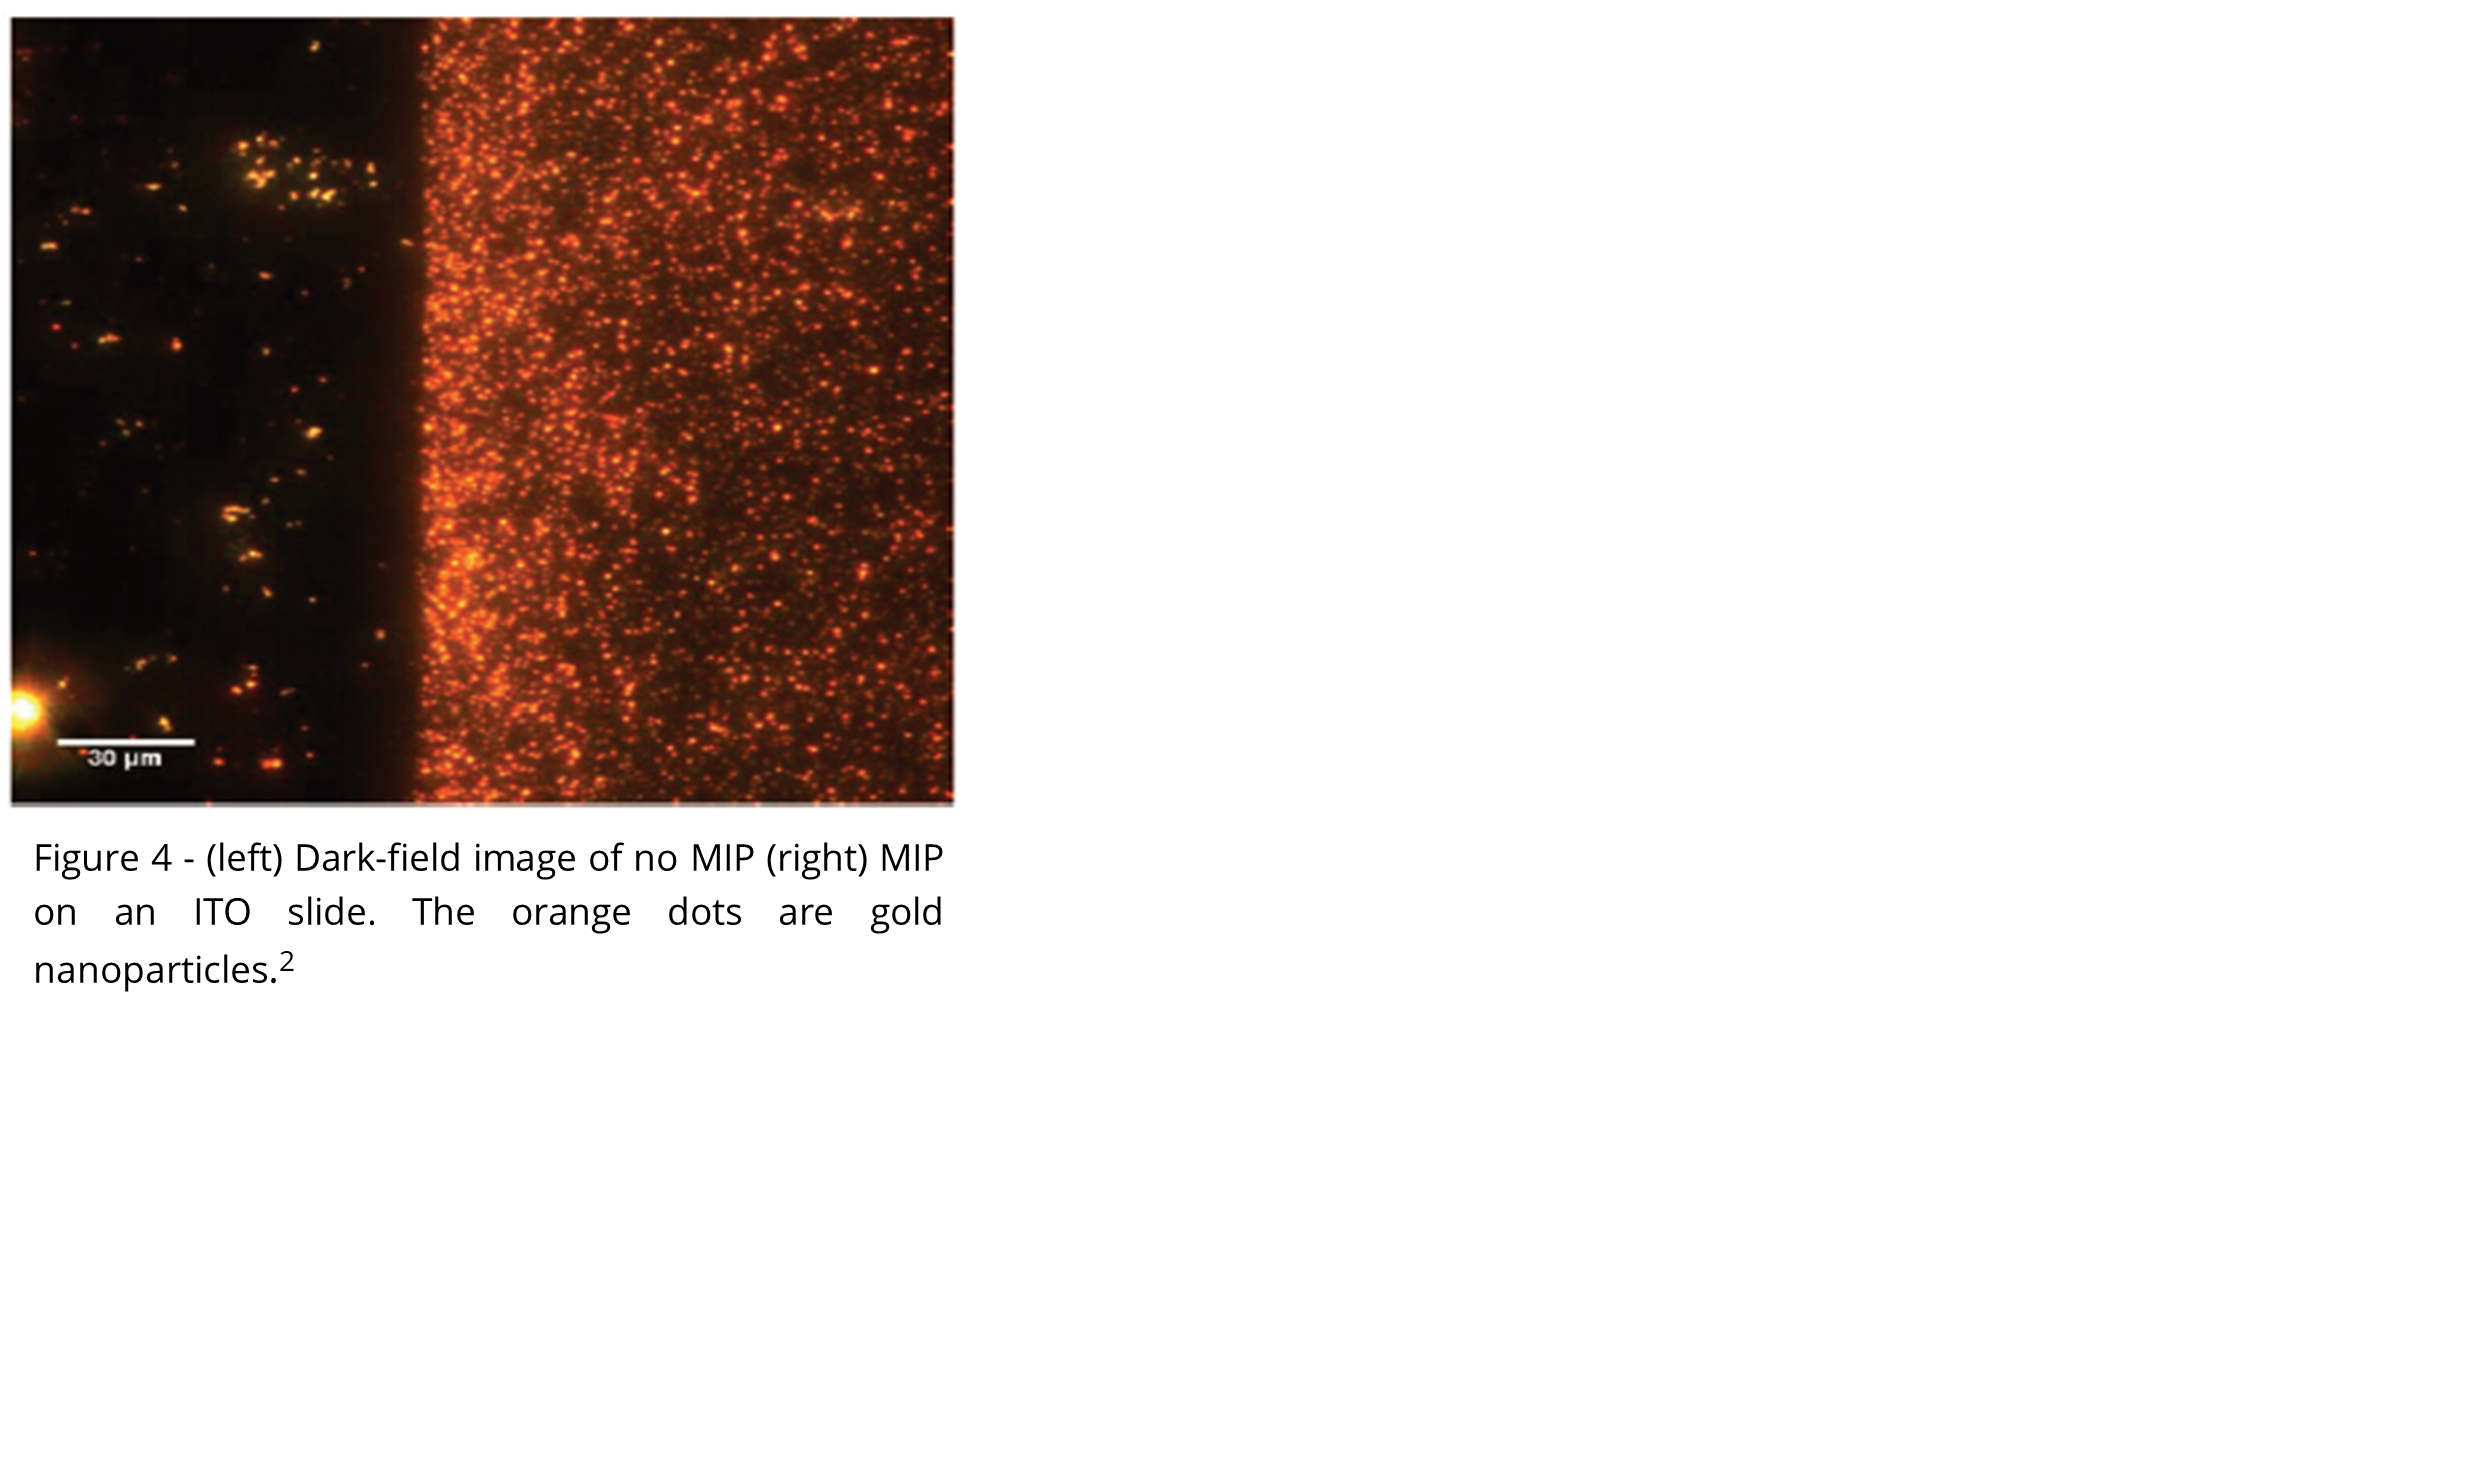
The sensor chips were functionalized with a molecularly imprinted polymer (MIP) selective for RDX. The MIP was prepared by crosslinking a bisaniline polymer with Au nanoparticles.2,3 SPR sensors were first validated in the laboratory with aqueous RDX solutions before field deployment.
4Calibration and Analytical Protocol
lab
- MIP functionalization
- Lab validation
~30 min
- Deploy instrument
- Connect pumps
- Distilled water baseline
~20 min
- Uncontaminated well water
- 10 nM RDX standard
triplicate, n=3
- Well water as collected
- Real-time reference subtraction
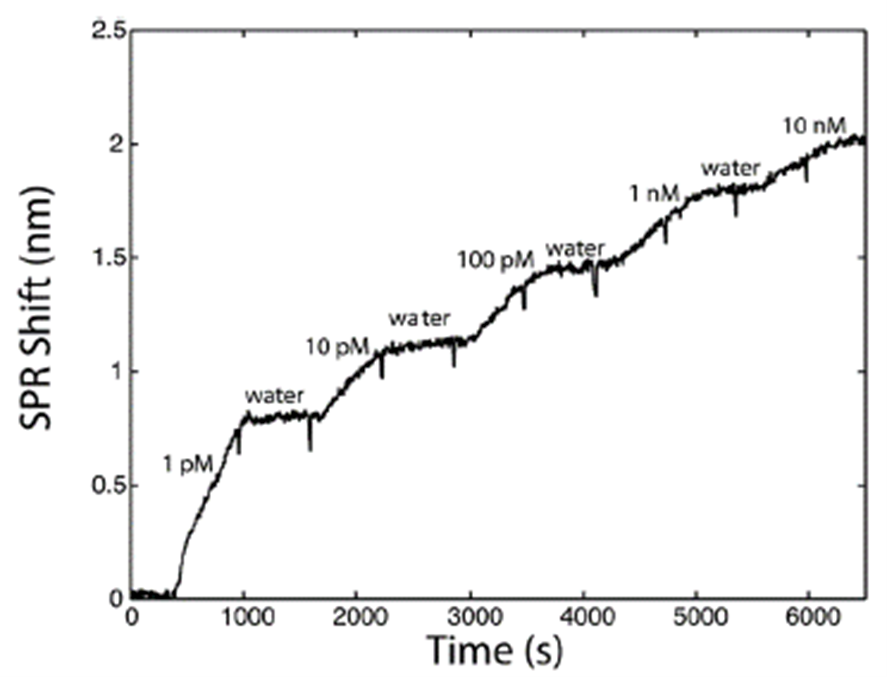
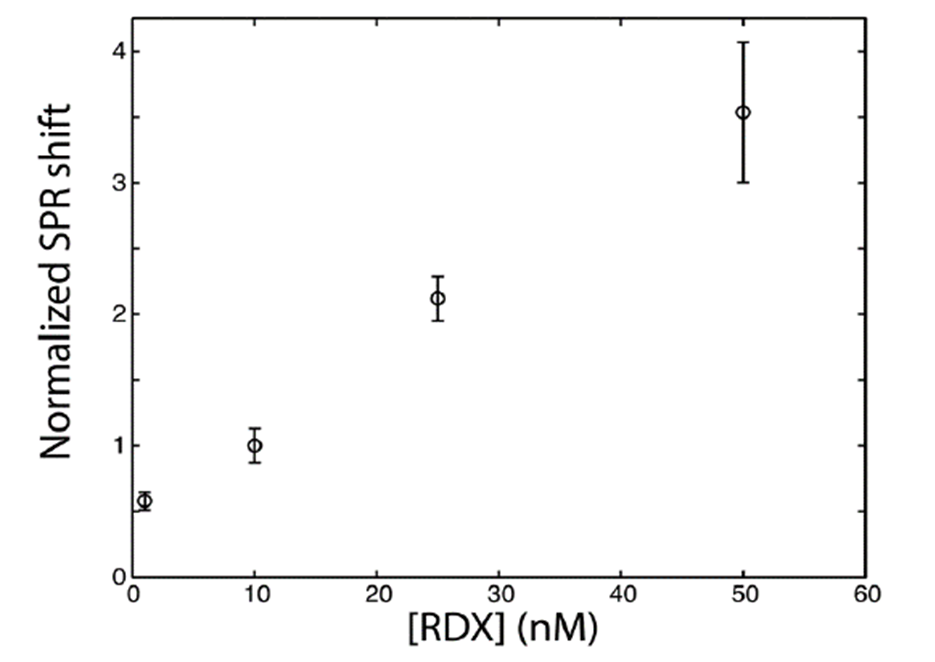
The sensitivity of the SPR sensor was characterized in the laboratory with RDX solutions from 1 pM to 10 nM, flowed successively at 1 mL/min. For temperature compensation, calibration curves from 1 nM to 50 nM were recorded across 2 °C to 36 °C. Standards were prepared in uncontaminated water from an upstream well. Each contaminated sample was analyzed relative to uncontaminated water, and all responses were normalized to the signal at 10 nM RDX.
Results and Discussion
Laboratory Validation — Sensorgram and Calibration
![Normalized calibration curves for RDX detection at different temperatures (2°C, 20°C, 36°C), plotted as normalised SPR shift vs. log[RDX] in M. Curves converge after normalization to the 10 nM signal, confirming consistent sensitivity across the temperature range.](../assets/appnotes/rdx-fig6-temp-calibration.png)
Prior to field testing, the SPR method was validated in the laboratory across the full expected temperature range. The primary temperature effect was on sensor sensitivity; however, normalizing calibration curves against the SPR signal at 10 nM provided consistent sensitivity for concentrations above 0.1 nM throughout the relevant temperature window (Figure 6). This normalization approach was applied in all subsequent field measurements.
Field SPR Testing
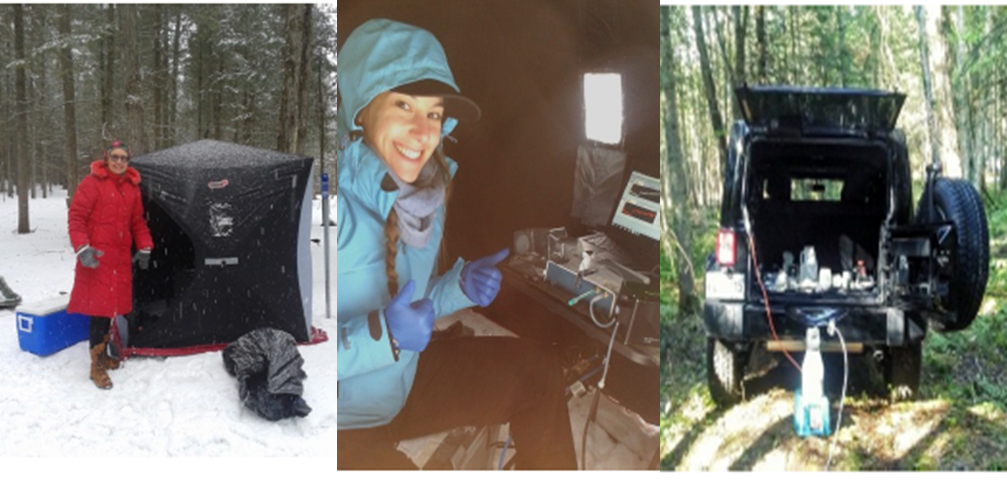
The current field-testing approach requires minimal infrastructure. A temporary shelter — a tent, trailer, or the tailgate of an SUV — proved sufficient in all tested conditions. From on-site arrival to a complete SPR result took up to 90 minutes per well, including instrument setup, baseline equilibration with distilled water and uncontaminated well water, sample measurement, and recalibration.
Compared to EPA method 8330b, the field SPR approach eliminates sample transportation and preparation. The method is significantly faster and more suitable for frequent monitoring, particularly in remote areas where centralized lab access is difficult.
Field SPR data showed excellent correlation with HPLC EPA method 8330b results across all sampled wells, confirming its potential not only as a rapid screening tool but as a viable alternative for on-site monitoring of energetic materials in groundwater.
Comparison with EPA Method 8330b
Table 1 presents a side-by-side comparison of RDX concentrations measured by portable SPR and by the laboratory HPLC standard across wells sampled on site. Concentrations are reported in ppb; 2 ppb corresponds to approximately 10 nM.
| Method | Well 1 (ppb) | Well 2 (ppb) | Well 3 (ppb) |
|---|---|---|---|
| EPA 8330bb | 5.8 | 3.8 | 1.9 |
| SPR — on site | 6.2 ± 1.2 | 2.2 ± 0.1 | 1.8 ± 0.3 |
| SPR — laboratory | 4.5 ± 0.8 | 3.0 ± 0.4 | 1.8 ± 0.2 |
Table 1. RDX concentrations (ppb) measured by SPR (on-site and laboratory) vs. EPA method 8330b across three downgradient wells.
a Conditions: late summer, 27–29 °C, dew point below 14 °C. b EPA method 8330b has a 1–3% RSD. 2 ppb ≈ 10 nM.
The P4SPR Advantages
Portable & Field-Ready
Compact, USB-powered design operates reliably from -20 °C to +30 °C — in a tent, a trailer, or the back of a truck.
Rapid Time-to-Result
90 minutes from on-site arrival to result, versus 24+ hours for sample transport and HPLC analysis in a centralized lab.
No Sample Preparation
Samples are analyzed directly as collected from the well — no filtration, extraction, or reagent preparation required.
Tunable Selectivity
Sensor surface chemistry is tailored to the analyte of interest. MIP-based chips deliver high selectivity for small molecules such as RDX in complex environmental matrices.
Conclusion
This study demonstrates that the P4SPR delivers exceptional analytical performance for on-site analysis of RDX directly at groundwater sampling wells. With excellent correlation to EPA method 8330b and consistent results validated against laboratory analysis, the P4SPR can be deployed with confidence for rapid field testing of energetic materials in remote areas.
The portability and robustness of the instrument confirm its suitability for environmental monitoring, with clear opportunities to expand its applications to other contaminants of concern.
- M. Mailloux, R. Martel, U. Gabriel, R. Lefebvre, S. Thiboutot and G. Ampleman, J. Environ. Qual., 2008, 37, 1468.
- T. Brule, G. Granger, N. Bukar, C. Deschenes-Rancourt, T. Havard, A. R. Schmitzer, R. Martel and J.-F. Masson, Analyst, 2017, 142, 2161.
- M. Riskin, R. Tel-Vered and I. Willner, Adv. Mater., 2010, 22, 1387–1391.