The path from a new DNA probe design to a working clinical biosensor is long, expensive, and full of dead ends. Every probe variant needs to be synthesized, tested, and optimized. Every aptamer needs its surface density, conformation, and matrix compatibility tuned. Most of this work happens before anyone even knows if the final device will perform.
What if you could screen all of that optically — label-free, in real time, on a benchtop instrument — before committing to the costly chemistry?
That’s exactly what four recent studies demonstrate, and together they trace the full arc from rational probe design to a wearable device monitoring insulin in a living animal.
SPR Matches Electrochemistry for DNA Hybridization
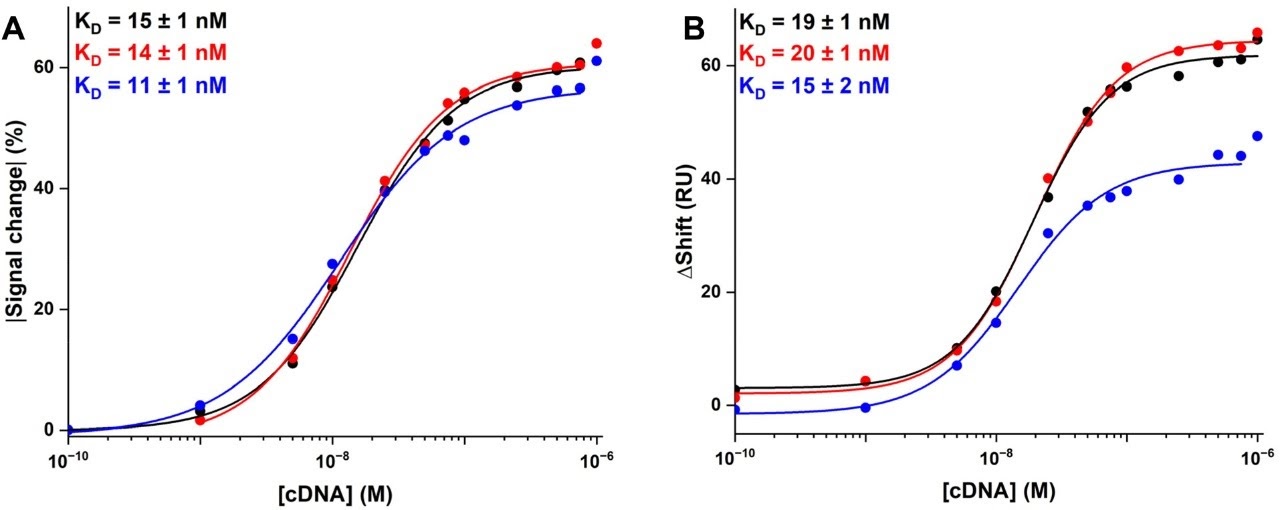
Fontaine et al. (Analyst, 2025) at Université de Sherbrooke ran a direct head-to-head comparison: SPR and electrochemical detection on the same gold surface, same DNA probes, same concentrations. The result? Equivalent limits of detection, matching sigmoidal dose-response curves, and consistent probe-length scaling across both methods.
The practical takeaway: researchers can screen probe designs with label-free SPR first, then commit to expensive redox-reporter synthesis only for the winners. SPR becomes the rational design tool before electrochemistry even enters the picture.
A Hydrogel That Monitors Vancomycin for Weeks
Park et al. (JACS, 2025) at the BioMed X Institute took aptamer-SPR a step further. They built an “aptagel” — a split-aptamer cross-linked hydrogel film on a plasmonic surface that contracts when vancomycin binds, producing a measurable SPR shift.
The numbers are striking: 6–9× sensitivity improvement over conventional monolayer aptamers, full reversibility within 20 minutes without regeneration reagents, and five weeks of stability in diluted plasma at 37°C. This is biosensor performance that starts to look clinical.
MD Simulation Replaces Months of SELEX
Basini et al. (Nano Today, 2026) asked: what if you could skip the traditional 8–15 rounds of aptamer selection entirely? Their approach combined molecular dynamics simulation with SPR kinetic validation to rationally design PNA aptamers for cardiac troponin I — the gold-standard heart attack biomarker.
The PNA aptamers achieved picomolar affinity in shorter sequences than their DNA parents, while being completely invisible to nucleases. The entire design cycle compressed from months to days: computation generates hypotheses, SPR tests them.
The Endpoint: A Wearable That Tracks Insulin
Garg et al. (Nature Reviews Bioengineering, 2025) showed what this pipeline looks like at the finish line. The Aptalyzer — developed at McMaster, Waterloo, and Stanford — integrates hydrogel microneedles with electrochemical aptamer-based sensing to monitor insulin continuously in interstitial fluid. In preclinical rodent studies, it tracked insulin, glucose, and lactate simultaneously for multiple days.
The electrochemical readout in that device is the downstream deployment of molecular interfaces that were first characterized and optimized by SPR.
Why This Matters
Every aptamer biosensor deployed in a wearable device depends on the quality of the aptamer-surface interface at its core. Probe length, surface density, conformation, matrix compatibility — all of it needs to be optimized before the device can be built. That optimization work — iterative, high-throughput, label-free — is what benchtop SPR is built for.
The translation from bench to wearable clinic is happening now, and SPR is how it starts.
Read the full technical note: TN-02 — DNA Hybridization & Aptamer Biosensor Development with SPR covers all four studies in detail, with figures, data tables, and the complete reference list.