Resources · SPR Guide

Decoding SPR Sensorgrams

A field guide to every sensorgram shape we've seen across hundreds of labs in 10 countries — what it means, and how to fix it.

← Back to Resources
What are you seeing? No signal High signal Baseline rising Baseline drifting Spikes / drops Noisy data Slow dissociation Poor model fit Clear filter

No exact match

Try a different symptom, or contact us — we've likely seen it.

1
Setup & Ligand Issues
Problems with ligand immobilization, regeneration, and sensor chip preparation.

The 5 Phases of a Sensorgram (BASDR)

RU Time → kon ↑ KD equilibrium koff ↓ ↺ replay Analyte Ligand (immobilized) Gold film
B
Baseline
Buffer flows over the sensor, establishing a stable reference signal.
A
Association
Analyte moves to the surface via mass transport and binds to the ligand.
S
Steady-State
Net rate of bound analyte is zero. Saturation may or may not be reached.
D
Dissociation
Buffer returns; analyte dissociates from the ligand.
R
Regeneration
Low pH buffer removes remaining bound analyte to restore the surface.
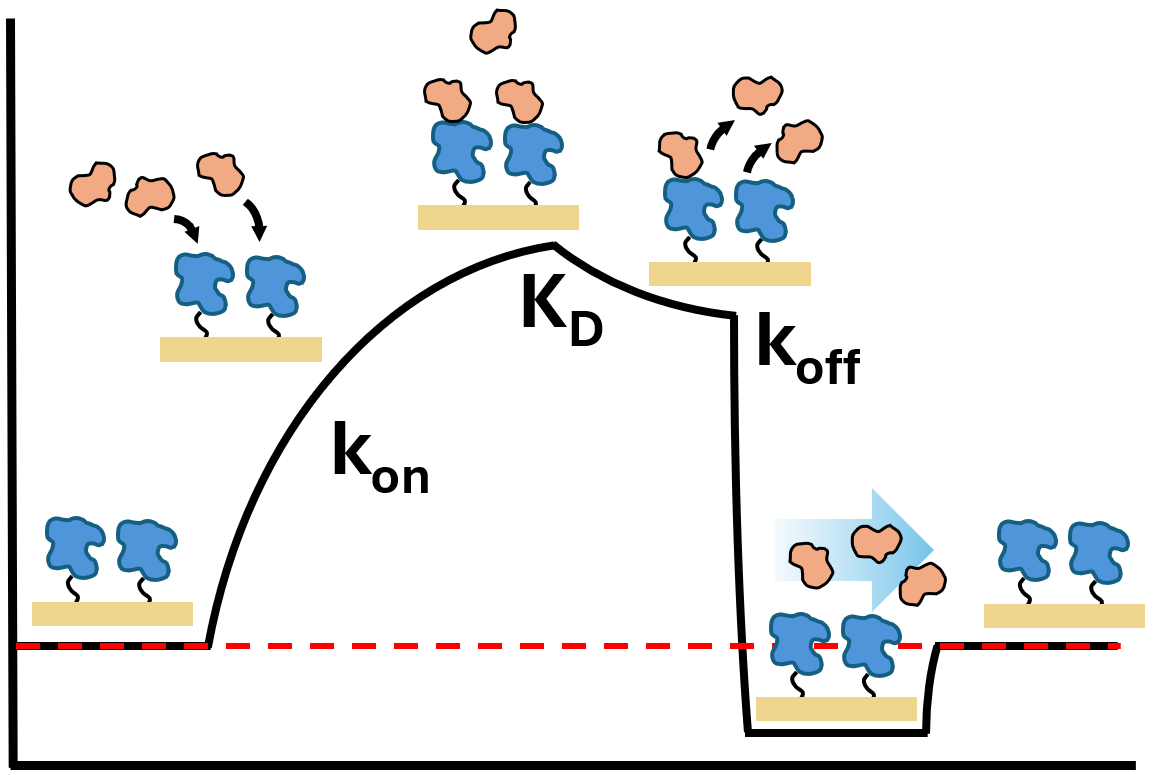
k_on / K_D / k_off — SPR binding kinetics diagram
Setup No signal
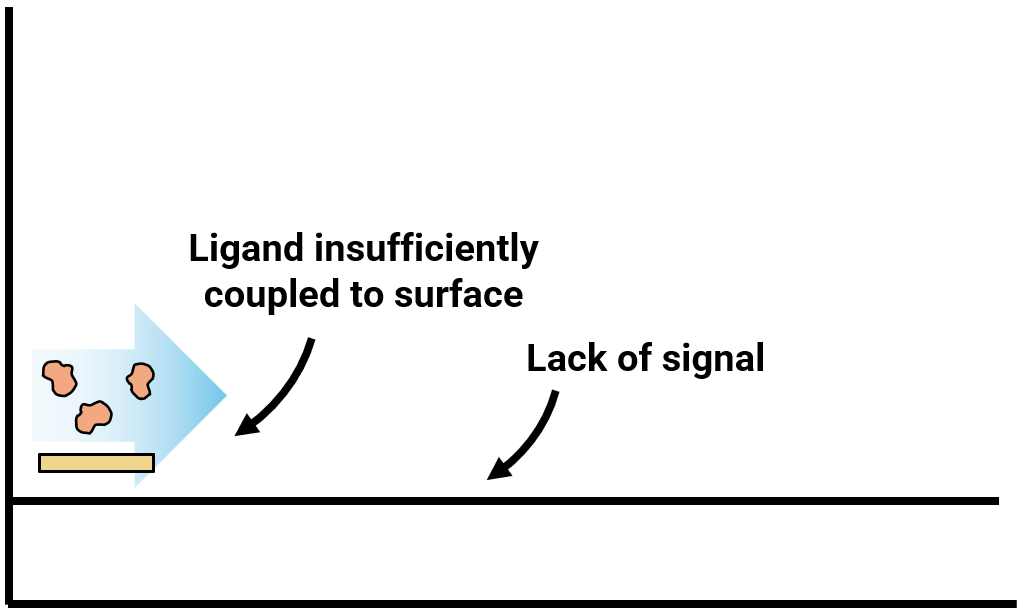
Insufficient Ligand Immobilization
Symptoms
  • Low or no RU response after analyte is flowed
  • Flat sensorgram with no binding signal
Fix
  • Increase ligand concentration
  • Increase coupling time
  • Change surface chemistry
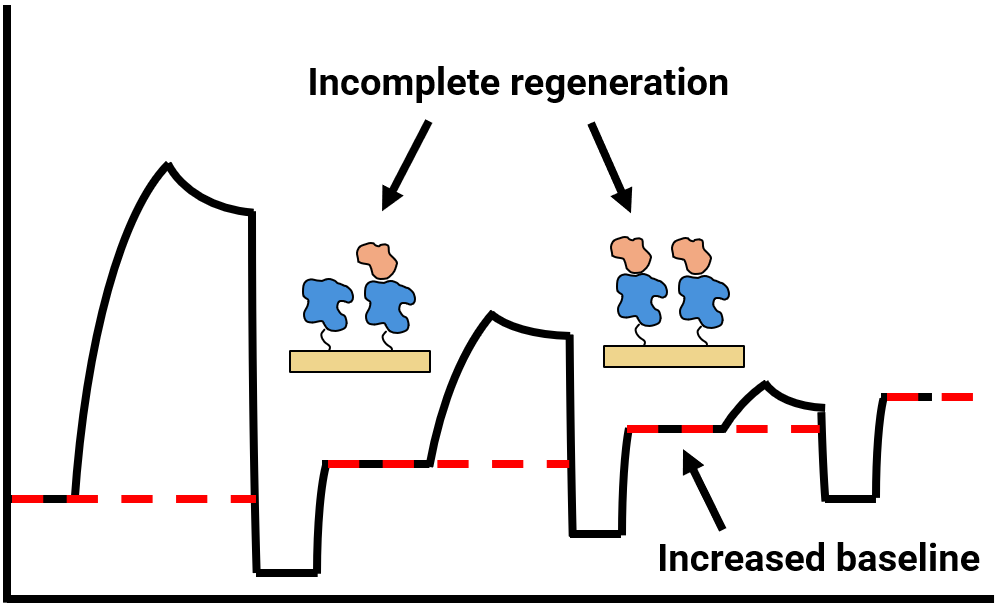
Incomplete regeneration — progressive baseline
Setup Baseline rising
Incomplete Surface Regeneration
Symptoms
  • Analyte not fully cleared between cycles
  • Progressive baseline increase across runs
  • Reduced binding capacity in subsequent cycles
Fix
  • Optimize regeneration buffer composition, pH, and ionic strength
  • Follow with original running buffer to re-establish baseline
  • Check for non-specific binding; increase flow rate and regeneration time
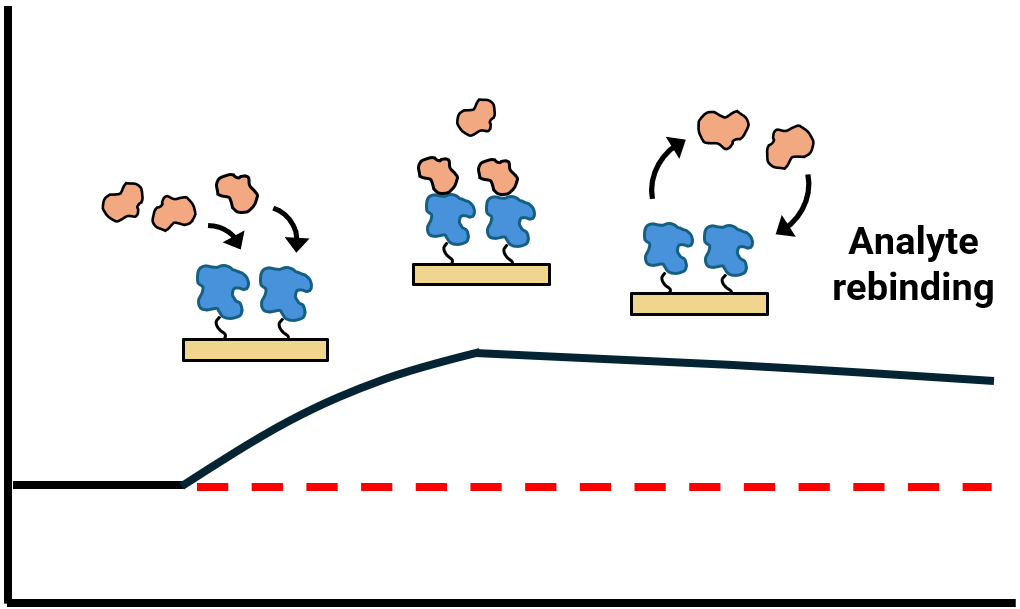
Rebinding — flat dissociation
Setup Slow dissociation Poor model fit
Rebinding Effects
Symptoms
  • Analyte rebinds to nearby ligands after dissociation
  • Dissociation does not follow a single exponential
  • Baseline never recovered in dissociation phase
Fix
  • Decrease ligand density on sensor; increase flow rates
  • Use single-cycle kinetics
  • Inject soluble ligand as competitor during dissociation
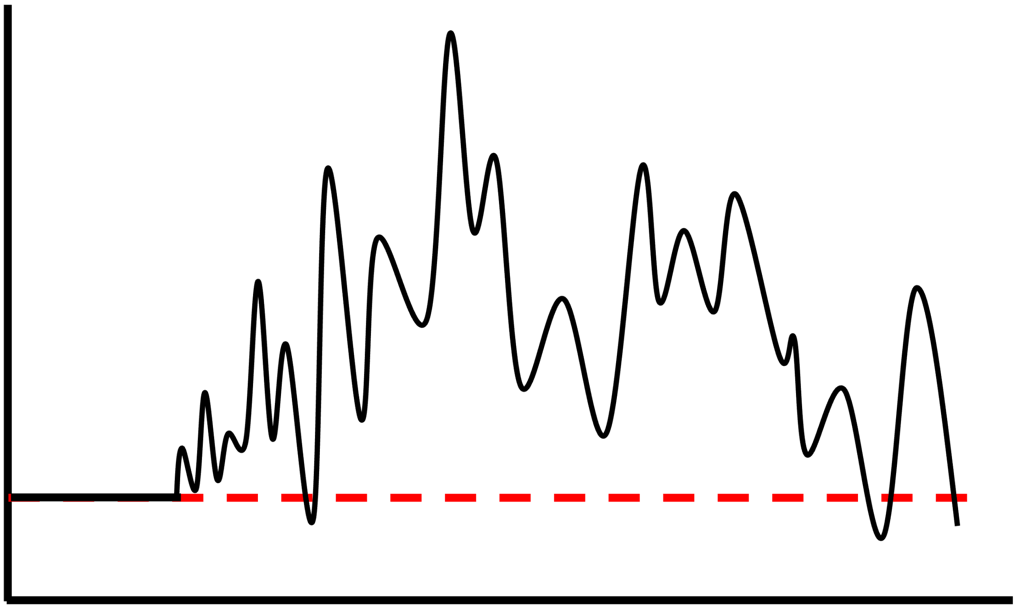
Noisy sensorgram
Setup Noisy data
Noisy Data
Symptoms
  • High noise obscuring binding signal
  • Erratic RU fluctuations across the entire run
Fix
  • Increase analyte concentration
  • Increase amount of immobilized ligand on sensor
2
Assay Issues
Issues arising from analyte preparation, buffer composition, and assay conditions.
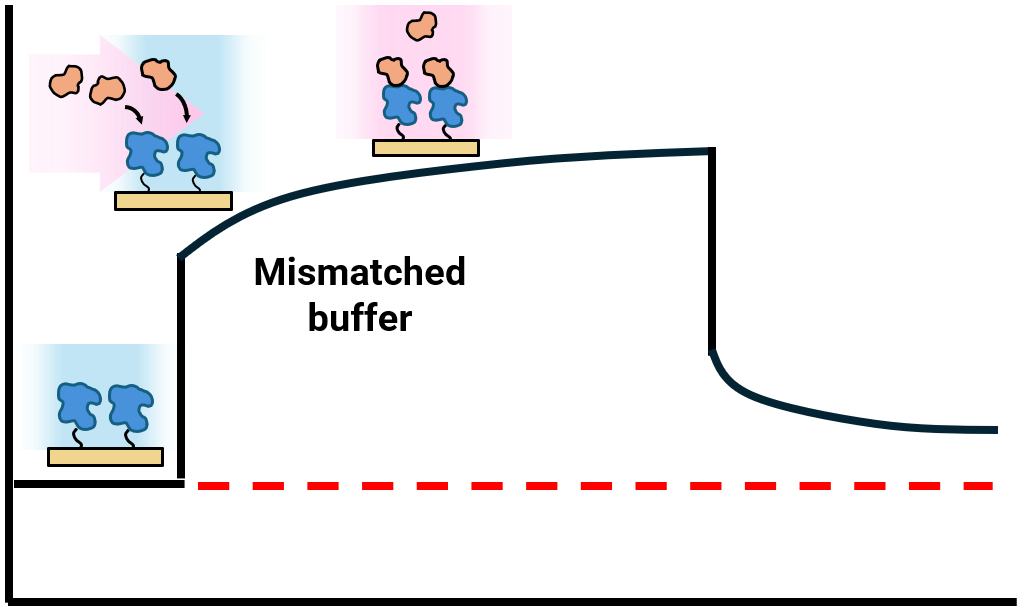
Buffer mismatch — bulk shift
Assay High signal Poor model fit
Buffer Mismatch (Bulk Shift)
Symptoms
  • Square-shaped artifact in the binding curve
  • Large, rapid RU changes at start and end of injection
  • Analyte and running buffer compositions differ
Fix
  • Match analyte buffer components with running buffer
  • Dialyze or filter analyte into the same running buffer
  • Run buffer-only reference and subtract from analyte experiment
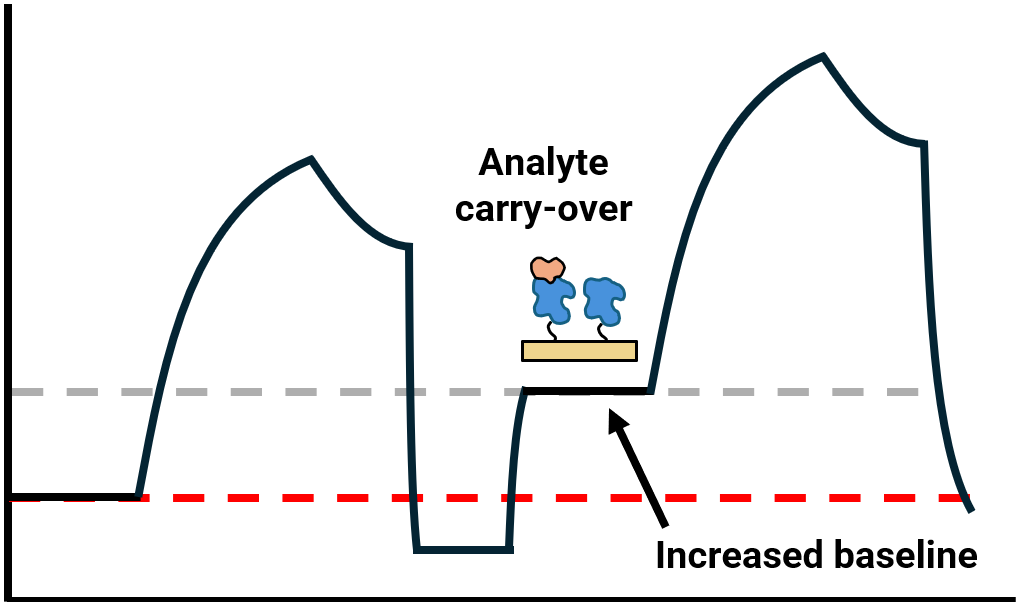
Carryover — increased baseline
Assay Baseline rising Spikes / drops
Carryover Between Cycles
Symptoms
  • Baseline increases across subsequent cycles
  • Sudden buffer jumps or spikes at the start of analyte injection
  • Often caused by high salt or sticky analyte
Fix
  • Verify complete regeneration between cycles
  • Reformulate analyte buffer
  • Add extra washing steps between injections
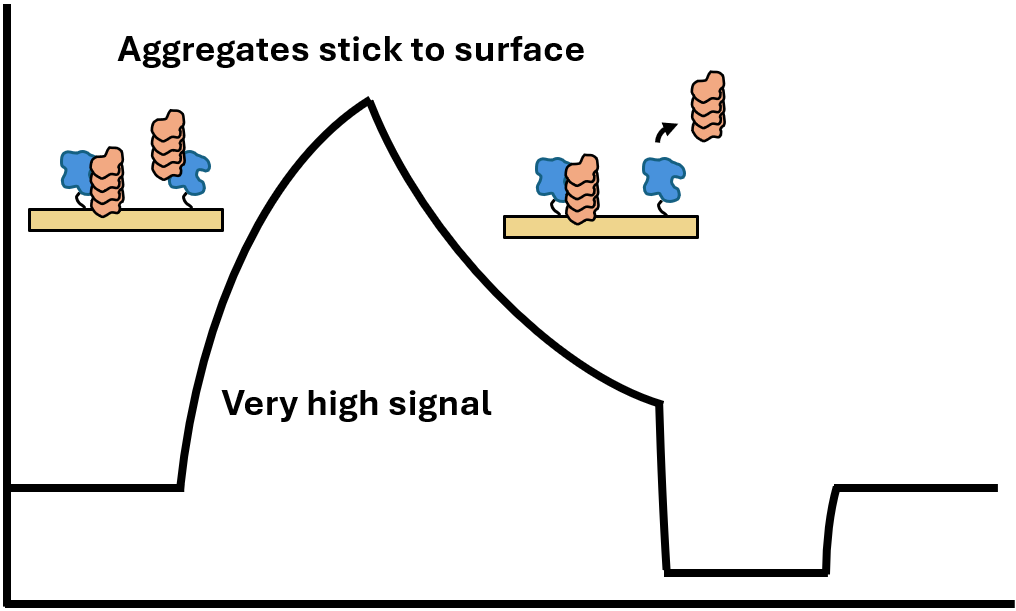
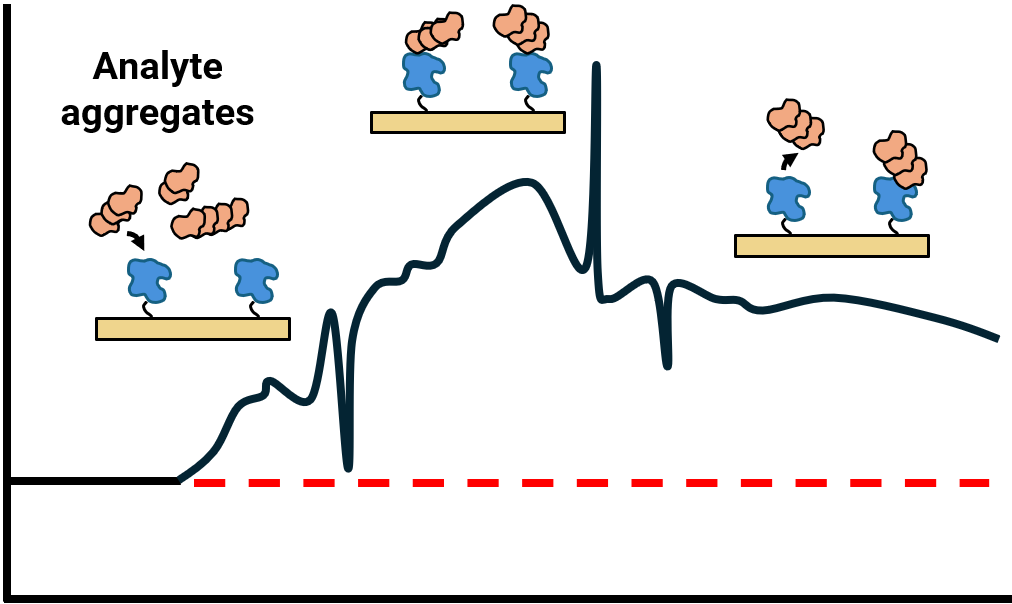
Aggregation — very high signal Aggregation — erratic curve
Assay High signal Noisy data Spikes / drops Poor model fit
Analyte Aggregation
Symptoms
  • Erratic, irregular or noisy binding curves
  • Sharp transient spikes or jumps in signal
  • Abnormally high RU and poor model fitting
Fix
  • Check protein folding and monodispersity
  • Reformulate analyte buffer; replenish with fresh soluble analyte
  • Filter or centrifuge to remove aggregates before injection
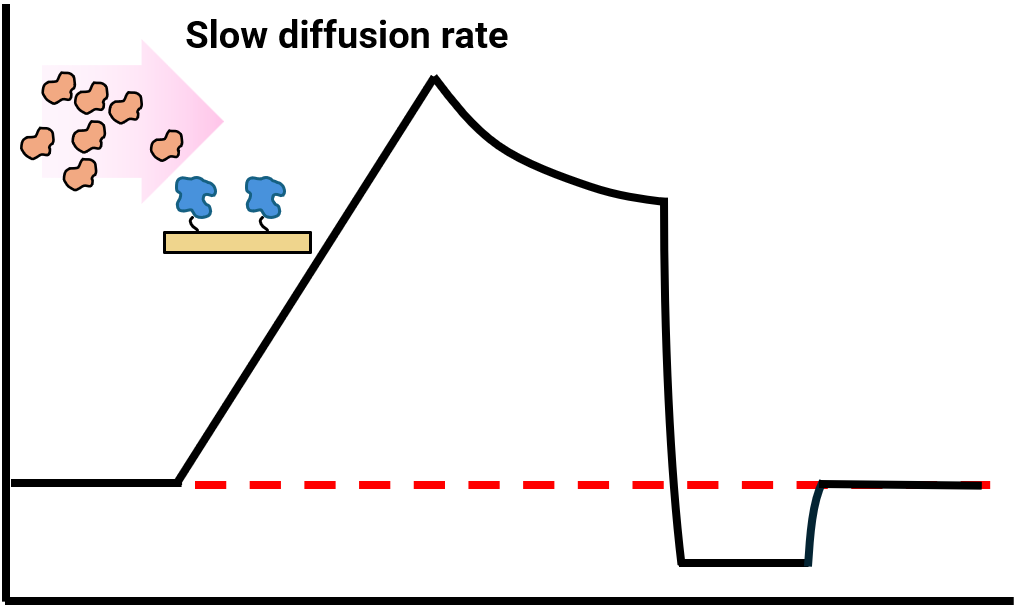
Mass transport limitation
Assay Slow dissociation Poor model fit
Mass Transport Limitations (MTL)
Symptoms
  • Slow, gradual RU increase during association — faster at higher flow rates
  • Analyte diffusion slower than binding rate
  • Poor data modeling at low analyte concentrations
Fix
  • Use higher flow rates and low-viscosity buffer
  • Decrease ligand density on the sensor
  • Use MTL-corrected models for data fitting
P4PRO is designed to minimize MTLs by delivering analyte quickly and evenly across the sensor surface.
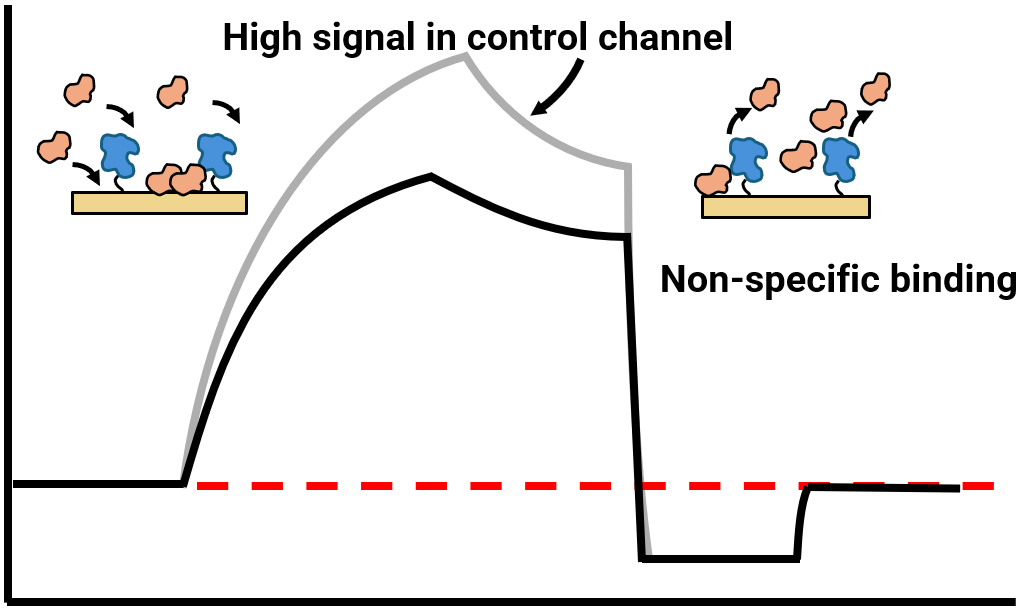
Non-specific binding — high reference channel
Assay High signal Poor model fit
Non-Specific Binding (NSB)
Symptoms
  • Steep RU increase from analyte interaction with sensor surface
  • High signal in reference channel — reflects diffusion, not binding
  • Poor model fitting
Fix
  • Increase salt concentration; adjust buffer pH
  • Add BSA or non-ionic surfactants (e.g., Tween 20)
  • Change ligand orientation or sensor surface chemistry

3
Operational, Instrumentation & Other Issues
Issues arising from instrument state, fluidics, temperature, and compound effects.
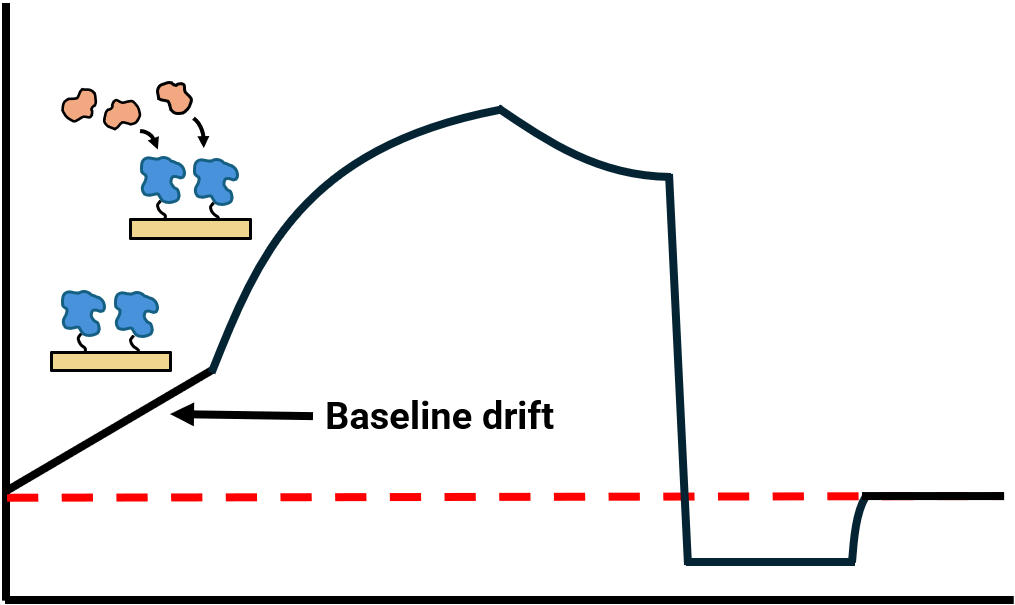
Baseline drift
Operational Baseline drifting
Baseline Drift
Symptoms
  • Gradual upward or downward RU drift during the run
  • May indicate temperature fluctuations, unstable sensor, or contamination
Fix
  • Stabilize temperature in the instrument environment
  • Replace sensor; equilibrate system with sufficient buffer
  • Flow running buffer until baseline is stable
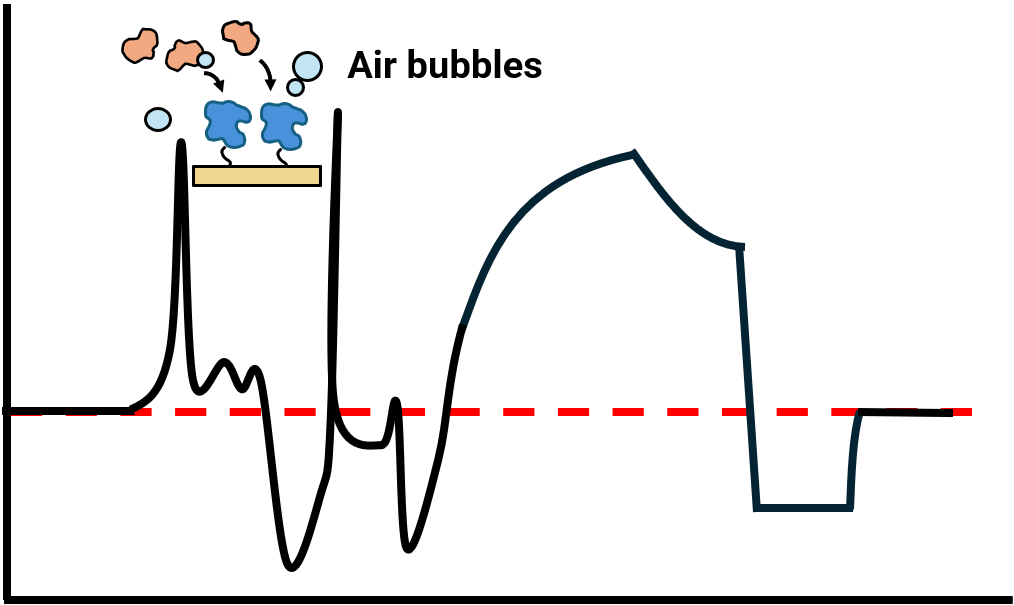
Air bubbles — unpredictable spikes
Operational Spikes / drops Noisy data
Air Bubble or Clog in Lines
Symptoms
  • Sudden, unpredictable RU spikes and drops during injection and dissociation
  • Erratic signal not correlated with binding events
Fix
  • Check instrument for fluidic leaks; purge lines
  • Degas samples before injection
  • Perform scheduled instrument maintenance
Injection failure — no RU response
Operational No signal
Injection Failure
Symptoms
  • No RU response after analyte injection
  • May be caused by valve malfunction, air in syringe, or software error
Fix
  • Check injection valves and syringe for air
  • Restart software and re-run system maintenance
Rounded peak — poor instrumentation
Instrumentation Poor model fit Slow dissociation
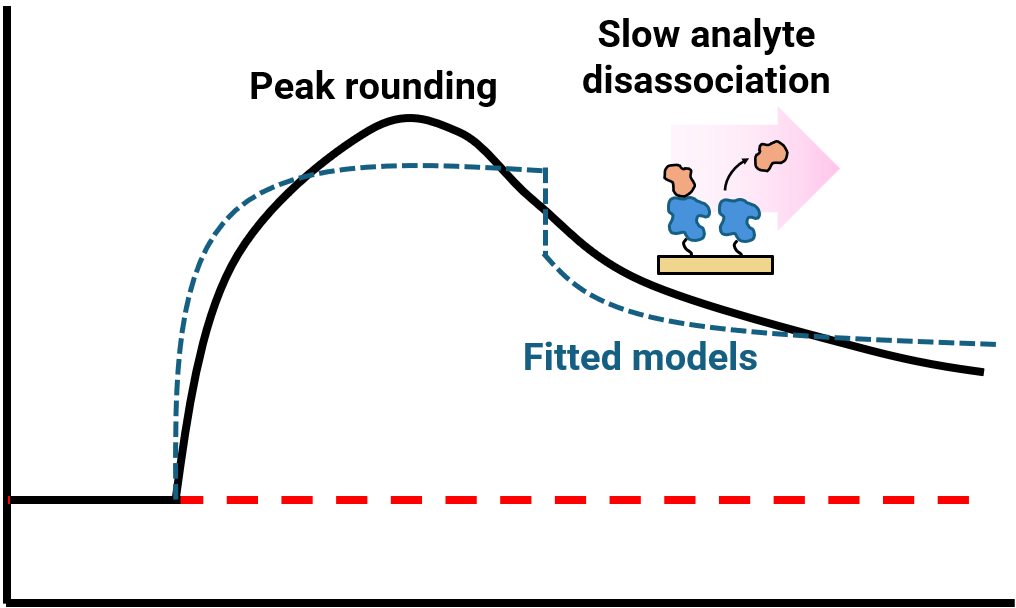
Rounded Peak
Symptoms
  • Inefficient analyte dissociation from the ligand
  • Over- or under-estimation of binding affinity
  • Poor fit with standard 1:1 global model
Fix
  • Implement a regeneration step
  • Use a fit model other than 1:1 global fit
Combination effects
Combined High signal Baseline rising Poor model fit
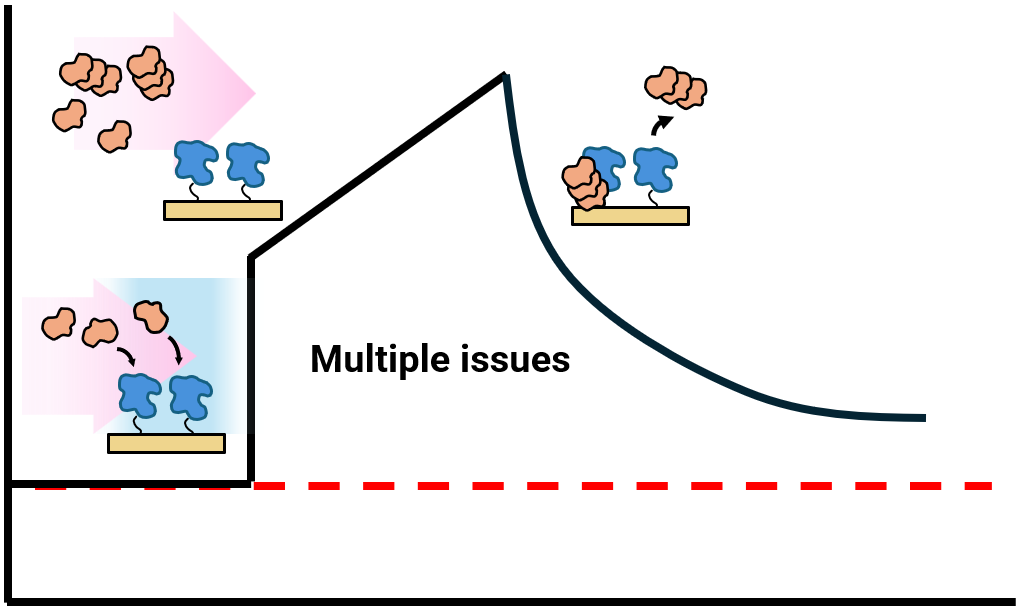
Combination Effects
Symptoms
  • MTLs, protein aggregation, and buffer mismatch simultaneously present
  • Linear upward climb during association with no equilibrium plateau
  • Steady higher baseline; poor fitting across all models
Fix
  • Diagnose each effect individually before applying fixes
  • Address buffer mismatch first, then aggregation, then MTL
  • Refer to Parts 1 & 2 for individual fix protocols
P4PRO is designed to minimize MTLs by delivering analyte quickly and evenly across the sensor surface.