
IN SHORT
- Surface partner: decide which of the two molecules goes on the surface (TN-06: The binding surface). It sets the signal size and what can go wrong, like a blocked binding site.
- Concentration series: inject at least five concentrations, from a tenth to ten times the expected affinity (KD), plus buffer alone.
- Reference channel: keep one channel as a reference and use the other three for samples and controls, all read in turn within each ~1 s cycle (TN-03: Lensless optics and wavelength readout).
Overview
A clean sensorgram starts before the first injection. Which molecule you put on the surface, which concentrations you inject, and which controls you run decide whether the result answers your question.
This note covers those choices. The surface itself is covered in TN-06: The binding surface, and the choice between static and flow in TN-08.
1 · LIGAND OR ANALYTE
Which partner goes on the surface
One partner is immobilized (the ligand), the other is injected (the analyte). Choosing which is which is the first design decision.
Example. For an antibody–antigen pair, injecting the antibody over the antigen measures avidity, not affinity. Capture the antibody on the surface instead (Protein A, TN-06: The binding surface) and inject the antigen.
| Weigh | Why it matters |
|---|---|
| Signal | The response grows with the mass that binds. A large analyte binding a small ligand gives a bigger signal than the reverse. |
| Valency | A two-armed analyte, like an antibody, can bind two ligands at once. That avidity makes dissociation look slower and affinity look tighter than the true one-to-one interaction. |
| Purity | Whatever is on the surface gets measured. A pure ligand, or one captured by a tag from a crude mix (TN-06: The binding surface), keeps the surface specific. |
| Stability | The ligand has to stay active through the whole run, including regeneration. |
| Regeneration | Pick the partner that tolerates the conditions needed to remove the other. |
2 · THE CONCENTRATION SERIES
The concentration series
To measure an affinity (KD), cover the range where binding changes most: roughly 0.1× to 10× the expected KD. Use at least five concentrations, evenly spaced on a log scale (a twofold or threefold dilution series), plus a zero (buffer only), and repeat one middle concentration to show the surface still responds the same at the end of the run.
If you fit steady-state binding, give each injection enough time to approach equilibrium; at low concentrations that takes longer. If the expected KD is unknown, start with a wide, coarse series, then refine.
Match the buffers. Dilute every sample into the running buffer, or exchange it. Glycerol, DMSO or salt carried over from a stock changes the refractive index and shows up as a large signal in every channel, which can look like binding (TN-09: Getting a clean signal).

3 · CONTROLS
Controls
Every run needs a way to tell real binding from everything else.
On a four-channel instrument, a common layout is one reference channel and three sample channels: for example a known binder, a test sample and a non-binder, all measured through the same optics, read in turn within each cycle of about one second (TN-03: Lensless optics and wavelength readout, TN-09: Getting a clean signal). For screening, the same four channels can test four candidates side by side against one ligand: in our protein–protein screening note, four candidate partners of an enterobactin-pathway enzyme were injected in parallel, one per channel.
| Control | What it tells you |
|---|---|
| Reference surface | Bulk refractive-index change and non-specific binding, to subtract from every sample channel |
| Buffer blanks | Drift and injection artefacts; subtracting them as well (double referencing) cleans up small signals |
| A known binder | The surface is active, today |
| A non-binder | The signal you see is specific |

4 · REPLICATES
Replicates
A replicate only means something if you say what was repeated. There are two kinds, and they answer different questions.
Repeat injections on the same surface. Injecting the same sample several times over one prepared surface shows that the measurement is reproducible: the instrument, the injection and the regeneration give the same response each time. It does not tell you whether a freshly prepared surface would give the same answer.
Independent surfaces. Preparing the surface again, on another chip or another day, and repeating the experiment shows that the result itself is reproducible. This captures the variation from immobilization (how much ligand is captured, and how much of it stays active), which is often larger than the variation between injections.
Benchmark studies across many labs show that surface preparation and analysis choices are large sources of variation. When you report a KD with error bars, say which kind of replicate they come from, and include independent surfaces whenever the number will be compared with other work.
5 · SMALL ANALYTES
When the analyte is small
The response grows with mass, so a small molecule binding a large protein gives a small shift. The detection limit depends on the instrument’s resolution and, just as much, on the assay design (TN-04: Where the precision comes from). Three formats turn a small signal into a large one.
Competition. Mix the small molecule with a large binding partner, often an antibody, and inject the mixture over a surface carrying the small molecule or an analogue. The more small molecule in the sample, the less the large partner binds: you measure a large molecule, not a small one.
Sandwich. After the analyte binds, inject a second binder (an antibody, or one carrying a nanoparticle) that adds mass on top.
Amplification on the surface. Gold nanoparticles grown on the sensor greatly increase the response; a drug (doxycycline) was detected this way on a P4SPR.
For direct binding of small molecules to an immobilized protein, a higher ligand density raises the signal. Small, fast-diffusing analytes tolerate more ligand than large ones. The advice in TN-06 still holds, the lowest density that gives a clean signal; for a small analyte that level is simply higher, and the mass-transport checks in TN-08 still apply. Reversible covalent inhibitors of a viral protease were characterized this way.

6 · STATIC OR FLOW
Static or flow
Endpoint binding, concentration and screening often work well in static mode; rate constants need controlled flow. The choice follows from your question (TN-08: Delivering the sample).
Related
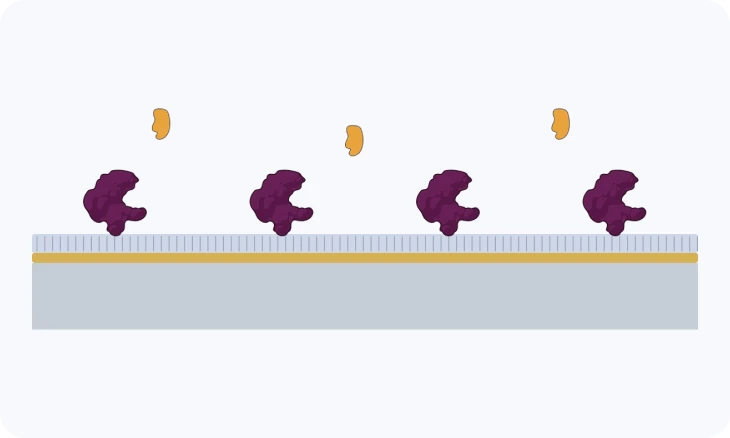
TECH NOTE · TN-06
The binding surface
Surface chemistries, coupling and capture, and how to choose one for your molecule.
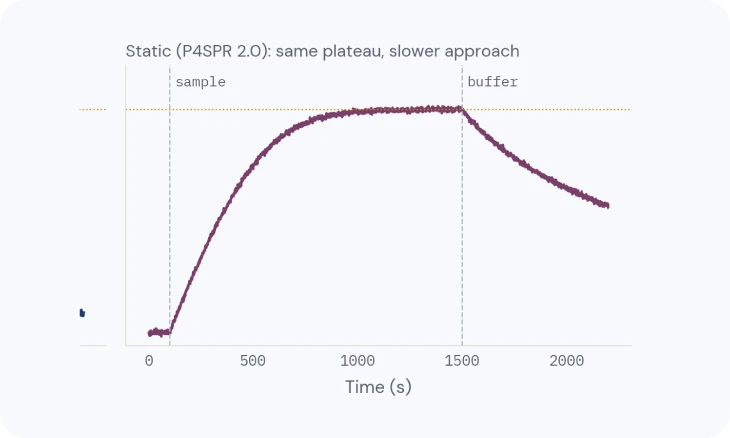
TECH NOTE · TN-08
Delivering the sample: static and flow
Diffusion, flow and mass transport, and when static is enough.
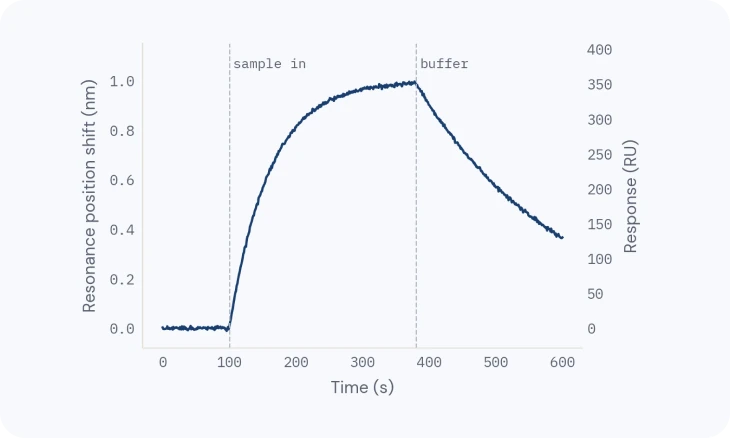
TECH NOTE · TN-10
From sensorgram to answer
Reading the curve, then affinity, kinetics and active concentration you can trust.